Key Takeaways
The verified 2026 USDA value per acre for every state, what it includes, and how far it sits from what bare land actually sells for.
- Rhode Island is the most expensive state at $23,600 an acre and New Mexico the cheapest at $735, a spread of about 32 to one.
- USDA’s figure covers land and buildings, including dwellings, so it runs well above the price of an empty parcel.
- Pastureland averages $2,000 an acre nationally, about 44 percent of the farm real estate figure, and is the closest public proxy for undeveloped ground.
- New York sits exactly on the national average of $4,500. Twenty five states are above it, twenty two below.
- Inside Texas alone, regional averages run close to tenfold apart, so a state number can never price a parcel.
Most pages that publish land prices by state copy a number and stop. The number is the easy part. Knowing what USDA counted when it produced that number is what separates a useful benchmark from a misleading one, and it is where almost every version of this article falls down.
Here is the short version before the table. The United States Department of Agriculture measures farm real estate, which is land plus every structure standing on it. A state average therefore includes barns, grain bins, equipment sheds and farmhouses. If your parcel is forty acres of raw ground with a gate on it, that average is not describing your parcel. It is describing a working farm in your state.
That does not make the number useless. It makes it a ceiling rather than an estimate, and once you know which direction it errs in, you can use it. What the number cannot do is price a specific parcel, which is why this page ends where it does. For that you want comparable sales, and our guide covering the Online land value estimator route, the free comps route and the paid appraisal route walks through all three.
Quick verdict: use the table below to learn the shape of the market, not to price your land. Take your state’s number, remember it includes barns and farmhouses, discount toward the pasture figure if your parcel is bare, then throw all of it away and use local comparable sales for the actual price.
What Are Average Land Prices by State in 2026?
The US average farm real estate value is $4,500 per acre for 2026, up $150 per acre or 3.4 percent from 2025. Cropland averages $6,020, an increase of $190 or 3.3 percent. Pasture averages $2,000, up $80 or 4.2 percent.
Those three national numbers come from the USDA NASS Land Values 2026 Summary, published annually at the end of July.
State values run from $735 per acre in New Mexico to $23,600 in Rhode Island. That is a spread of roughly 32 to one between the cheapest and priciest states, wider than most people expect and wide enough that a national average tells you very little about any particular place.
The pattern behind the spread is simple. Land is expensive where people want to live on it and where the soil produces a lot per acre, and cheap where neither is true.
What Is Land Worth Per Acre in Your State?
Every figure below is the 2026 farm real estate value per acre from the USDA NASS Land Values 2026 Summary, grouped by USDA farm production region. Alaska and Hawaii are not in the series.
| Region | State | 2026 value per acre |
| Northeast | Connecticut | $14,600 |
| Northeast | Delaware | $9,700 |
| Northeast | Maine | $3,400 |
| Northeast | Maryland | $9,950 |
| Northeast | Massachusetts | $15,200 |
| Northeast | New Hampshire | $6,670 |
| Northeast | New Jersey | $17,000 |
| Northeast | New York | $4,500 |
| Northeast | Pennsylvania | $8,700 |
| Northeast | Rhode Island | $23,600 |
| Northeast | Vermont | $4,490 |
| Lake States | Michigan | $7,000 |
| Lake States | Minnesota | $6,950 |
| Lake States | Wisconsin | $6,700 |
| Corn Belt | Illinois | $9,250 |
| Corn Belt | Indiana | $9,150 |
| Corn Belt | Iowa | $10,100 |
| Corn Belt | Missouri | $5,200 |
| Corn Belt | Ohio | $9,650 |
| Northern Plains | Kansas | $3,200 |
| Northern Plains | Nebraska | $4,400 |
| Northern Plains | North Dakota | $2,450 |
| Northern Plains | South Dakota | $3,100 |
| Appalachian | Kentucky | $5,600 |
| Appalachian | North Carolina | $5,750 |
| Appalachian | Tennessee | $6,500 |
| Appalachian | Virginia | $6,300 |
| Appalachian | West Virginia | $3,640 |
| Southeast | Alabama | $4,250 |
| Southeast | Florida | $9,150 |
| Southeast | Georgia | $4,950 |
| Southeast | South Carolina | $4,900 |
| Delta States | Arkansas | $4,350 |
| Delta States | Louisiana | $3,950 |
| Delta States | Mississippi | $3,650 |
| Southern Plains | Oklahoma | $2,620 |
| Southern Plains | Texas | $3,100 |
| Mountain | Arizona | $4,300 |
| Mountain | Colorado | $2,360 |
| Mountain | Idaho | $4,750 |
| Mountain | Montana | $1,260 |
| Mountain | Nevada | $1,230 |
| Mountain | New Mexico | $735 |
| Mountain | Utah | $3,650 |
| Mountain | Wyoming | $1,030 |
| Pacific | California | $14,100 |
| Pacific | Oregon | $3,880 |
| Pacific | Washington | $3,800 |
United States: $4,500 per acre.
Twenty five states sit above that national figure and twenty two below it. New York lands exactly on it at $4,500, which is a coincidence rather than a finding, but a useful one to carry around: it is the only state where the national average and the state average are the same number.
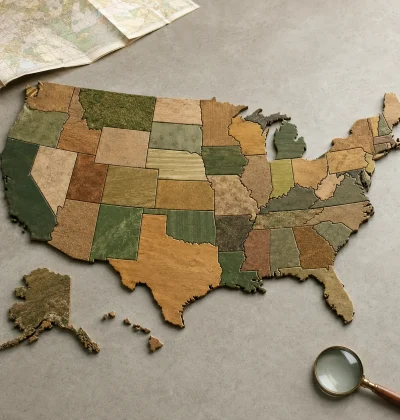
If you want the same data as a shaded map rather than a list, USDA publishes one for each category on its Land Values charts and maps page.
Which States Are Most and Least Expensive Per Acre?
The five priciest are Rhode Island at $23,600, New Jersey at $17,000, Massachusetts at $15,200, Connecticut at $14,600 and California at $14,100. Four of the five are small, crowded Northeastern states where farmland competes directly with housing. California is there for a different reason: irrigated cropland that produces more value per acre than almost anywhere on earth.
At the other end, the five cheapest are New Mexico at $735, Wyoming at $1,030, Nevada at $1,230, Montana at $1,260 and Colorado at $2,360. All five are arid, thinly populated, and dominated by rangeland that supports grazing rather than crops.
NASS put the range plainly in its own summary of the prior year: “At the state level, average value in 2025 ranged from $725 per acre in New Mexico to $22,500 in Rhode Island.” That sentence is worth quoting because it establishes both ends of the distribution from the agency that produced the numbers.
The gap is also widening. Rhode Island went from $18,900 in 2022 to $23,600 in 2026, a rise of about 25 percent. New Mexico went from $658 to $735 over the same five years, about 12 percent. Expensive land is appreciating roughly twice as fast as cheap land in percentage terms, which is the opposite of what most people assume about bargain states. The reasoning behind Why western land is cheap and which of those states are cheap for reasons you would want to avoid is a separate question with a separate answer.
Why Does the USDA Figure Overstate Bare Land Prices?
Because it counts the buildings. USDA defines farm real estate value as “The value at which all land and buildings used for agricultural production, including dwellings, could be sold under current market conditions, if allowed to remain on the market for a reasonable amount of time.”
Read that again slowly. Including dwellings. The state average you just looked up has farmhouses in it. It has machine sheds, barns, grain storage and irrigation infrastructure in it. None of that is on a bare parcel.
So how far off is it? The best public answer is the pasture figure. Pastureland is the least improved category USDA tracks, and nationally it averages $2,000 an acre against $4,500 for farm real estate. That is 44 percent. As a rough working adjustment, unimproved ground in an average state trades somewhere near half the headline farm real estate number, and often below it.
That is a rule of thumb, not a valuation. It fails in both directions. A five-acre lot on a paved road at the edge of a growing town can beat the farm average outright. A landlocked parcel with no legal access can sell for a fraction of the pasture figure, or fail to sell at all. Access, water, zoning and buildability move land prices more than state boundaries do, which is why our breakdown of Water features and water rights and the eleven other drivers is the more practical read once you have the benchmark in hand.
How Much Do Land Prices Vary Inside One State?
Enormously, and the variation inside a single state is large enough to swallow most of the national range. Texas is the clearest worked example because a second credible source tracks it independently.
USDA puts Texas farm real estate at $3,100 per acre for 2026. The Texas Real Estate Research Center at Texas A&M, which tracks actual rural land sales rather than farm assets, puts the statewide figure at $5,218 per acre in the second quarter of 2026. Two respectable measurements of the same state in the same year, 68 percent apart, because they are measuring different things.
Now look inside the state. TRERC’s regional breakdown for that quarter:
| TRERC region | Price per acre |
| Far West Texas | $1,139 |
| Panhandle and South Plains | $1,719 |
| West Texas | $3,008 |
| South Texas | $6,225 |
| Austin, Waco and the Hill Country | $8,040 |
| Northeast Texas | $8,604 |
| Gulf Coast and Brazos Bottom | $11,369 |
From $1,139 to $11,369 is close to a tenfold spread within one state. The national spread across all 48 states is about 32 to one. So a single large state contains roughly a third of the entire country’s range, and the figures come straight from the Texas Rural Land Markets quarterly series.
Any state with meaningful geographic variety behaves the same way. Eastern Colorado is not western Colorado. Coastal California is not the Central Valley. The state average is the midpoint of a distribution, and almost no parcel sits at the midpoint. Sellers working a specific market will find the state-level picture for Texas rural land markets more actionable than any national table.
How Do You Turn a State Average Into a Parcel Price?
You narrow the geography in steps until you are looking at sales instead of averages. State, then region, then county, then comparable parcels, and only the last step produces a number you can list at.
The standard the whole exercise is aiming at is fair market value, which the IRS defines as “The price that property would sell for on the open market. It is the price that would be agreed on between a willing buyer and a willing seller, with neither being required to act, and both having reasonable knowledge of the relevant facts.” No average of a state can satisfy that definition, because neither party to your sale is buying the state.
A workable sequence:
- Start with your state’s number above to learn whether you are in a cheap, average or expensive market.
- Adjust toward pasture if your parcel has no structures, using the national 44 percent ratio as a starting discount.
- Find three to five recent sales of parcels genuinely like yours: similar acreage, similar access, same county where possible.
- Convert every sale to price per acre so the comparison holds across different tract sizes.
- Adjust for the differences that remain, and reconcile to a single figure.
Steps three through five are the actual work, and the method for Adjust Each Comparable for Differences is where most of the accuracy lives.
Asking what an acre costs is a different question from asking what your acre is worth, and the price of a specific acre breakdown handles the first one by land type and region.
This is general information, not appraisal, tax or legal advice. For a figure you intend to rely on in a sale, a dispute or a tax filing, use a licensed appraiser and consult your attorney or CPA.
What Do People Get Wrong About State Land Averages?
The single biggest mistake is treating a state average as a parcel price. It leads to both overpricing and underpricing, and it costs sellers months. Four more, in the order they cause damage:
- Applying the farm real estate figure to raw land. The number includes dwellings. Using it unadjusted on bare ground overstates value, sometimes by half.
- Assuming a cheap state has no expensive land. New Mexico averages $735 an acre and still has parcels trading in five figures per acre near Santa Fe.
- Assuming an expensive state has no cheap land. California averages $14,100 and contains high desert selling for a small fraction of that.
- Comparing across categories without noticing. Cropland at $6,020, farm real estate at $4,500 and pasture at $2,000 are three different measurements. Quoting the one that flatters your position is the most common way land prices get misstated online.
There is also a coverage trap worth knowing about. USDA’s series excludes Alaska and Hawaii, so any article promising “all 50 states” from this dataset is either padding with a different source or not counting. Forty eight is the real number, and the table above has all of them.
Where Does a State Average Actually Help?
In three places, and only three. It tells you whether you are shopping in a cheap or expensive part of the country. It gives you a sanity check when an asking price looks absurd in either direction. And it lets you compare markets before you have done the work of finding comps in any of them.
For everything else it is the wrong instrument. A state number tells you the neighborhood; comps tell you the address. The USDA ERS farmland value topic page is the right place for the economics of why these numbers move, and it is worth reading if you want the trend rather than the level.
If you want to see how the table lines up against real asking prices rather than survey averages, Browse All 50 States on our marketplace and compare the listings in your county against your state’s figure above. The gap between the two is usually more informative than either number alone.
Pricing a parcel of your own? Run a free AI valuation on your parcel and check the result against the state benchmark, the pasture adjustment and your own comparable sales before you commit to a listing price.
Frequently Asked Questions
What is the average price of an acre of land by state in 2026?
State averages run from $735 per acre in New Mexico to $23,600 in Rhode Island, against a US average of $4,500. These are USDA farm real estate values, which include land plus agricultural buildings and dwellings. Bare unimproved parcels typically sell below the state figure, closer to the $2,000 national pastureland average.
Which state has the cheapest land per acre?
New Mexico, at $735 per acre in USDA’s 2026 farm real estate series, the lowest in the country. Wyoming follows at $1,030, then Nevada at $1,230, Montana at $1,260 and Colorado at $2,360. All five are arid western states with extensive rangeland, sparse population and little irrigated cropland to lift the average.
Which state has the most expensive land per acre?
Rhode Island, at $23,600 per acre in 2026, more than five times the national average of $4,500. New Jersey follows at $17,000, Massachusetts at $15,200, Connecticut at $14,600 and California at $14,100. Small size and dense population put farmland in direct competition with housing across the Northeast.
Is the USDA state land value the same as what vacant land sells for?
No. USDA measures farm real estate, defined as all land and buildings used for agricultural production, including dwellings. A bare parcel has none of that. Pastureland, at $2,000 per acre nationally against $4,500 for farm real estate, is the closer proxy for undeveloped ground at roughly 44 percent of the headline figure.
Why do land prices vary so much within a single state?
Because access, water, soil, zoning and distance to a town move prices more than state lines do. In Texas, regional averages ran from $1,139 to $11,369 per acre in the second quarter of 2026, close to a tenfold spread inside one state. That single range covers about a third of the entire national spread between states.
Resources and Further Reading
- USDA NASS Land Values 2026 Summary Primary source for every state figure on this page, published annually at the end of July.
- USDA NASS Land Values charts and maps State maps for farm real estate, cropland and pasture values.
- USDA NASS Land Values and Cash Rents 2025 Highlights Source of the quoted range from New Mexico to Rhode Island.
- USDA ERS farmland value Background on what drives farm real estate values and how the series is used.
- Texas Real Estate Research Center, Texas Rural Land Markets Q2 2026 Independent transaction-based data showing within-state variation.
- IRS Publication 561 The fair market value definition and the comparable sales approach to real property.